Business intelligence (BI) software systems help businesses create meaning from their data by analyzing it in large batches and presenting it in bite-sized chunks. There are many BI vendors that can help make data usable in this way, but two of the most popular options are Qlik and Tableau.
Both solutions source data from multiple data connectors to provide businesses with meaningful and actionable insights. However, each system is best for different kinds of businesses.
Qlik is best for quickly growing large enterprises that handle a significant volume of data on a regular basis. Its AI-backed data presentation services and multiple node deployments make it an excellent fit for sprawling workplaces. Tableau, however, is better suited to smaller businesses with local operations and agile processing needs.
If neither of these BI solutions seems like the best fit for your organization, you can explore more solutions on our comprehensive list of BI software.
Qlik

Pros
Cons
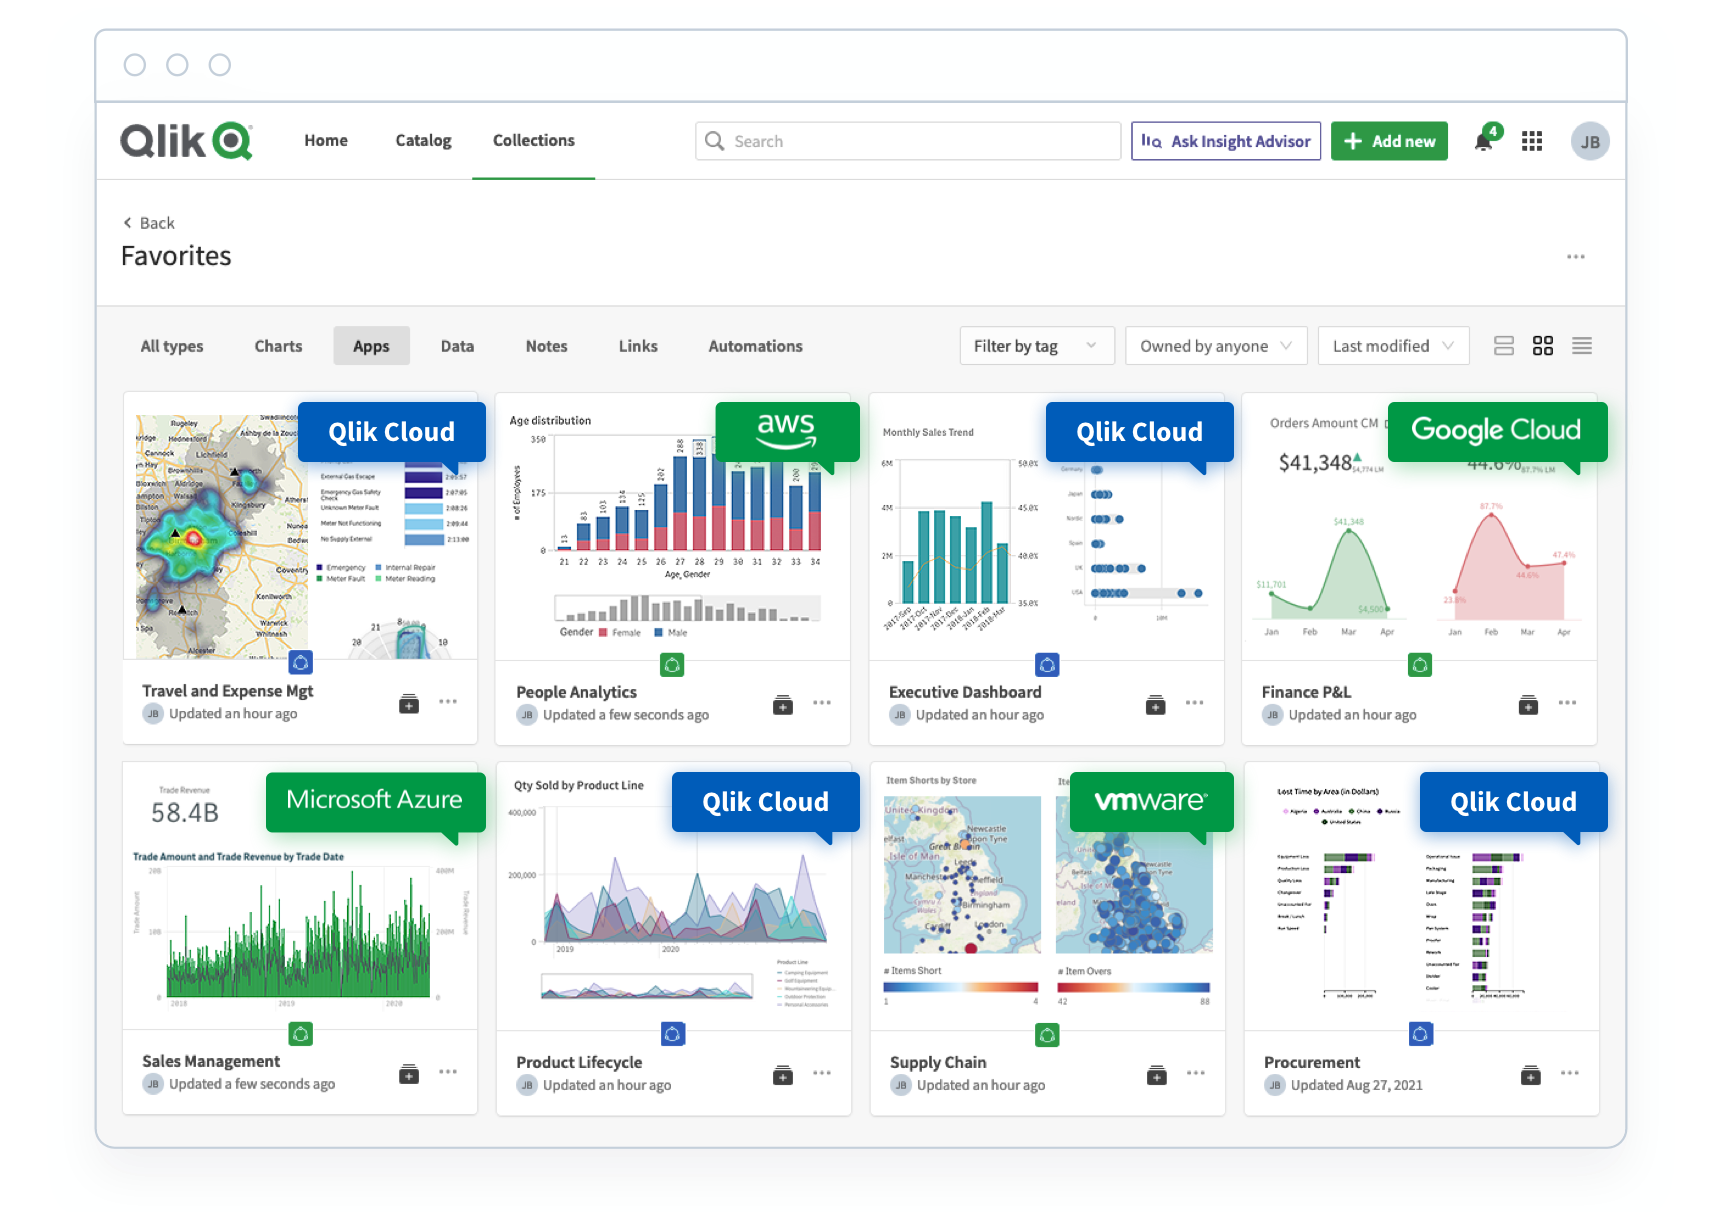
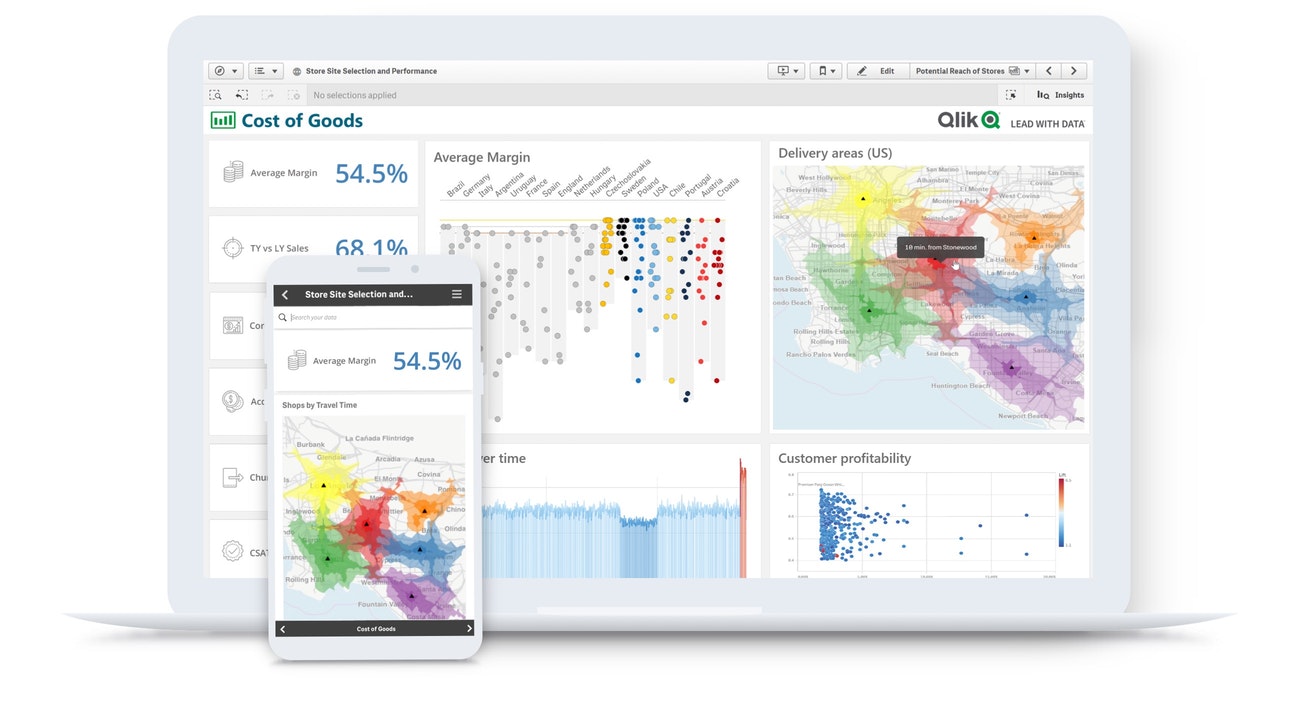
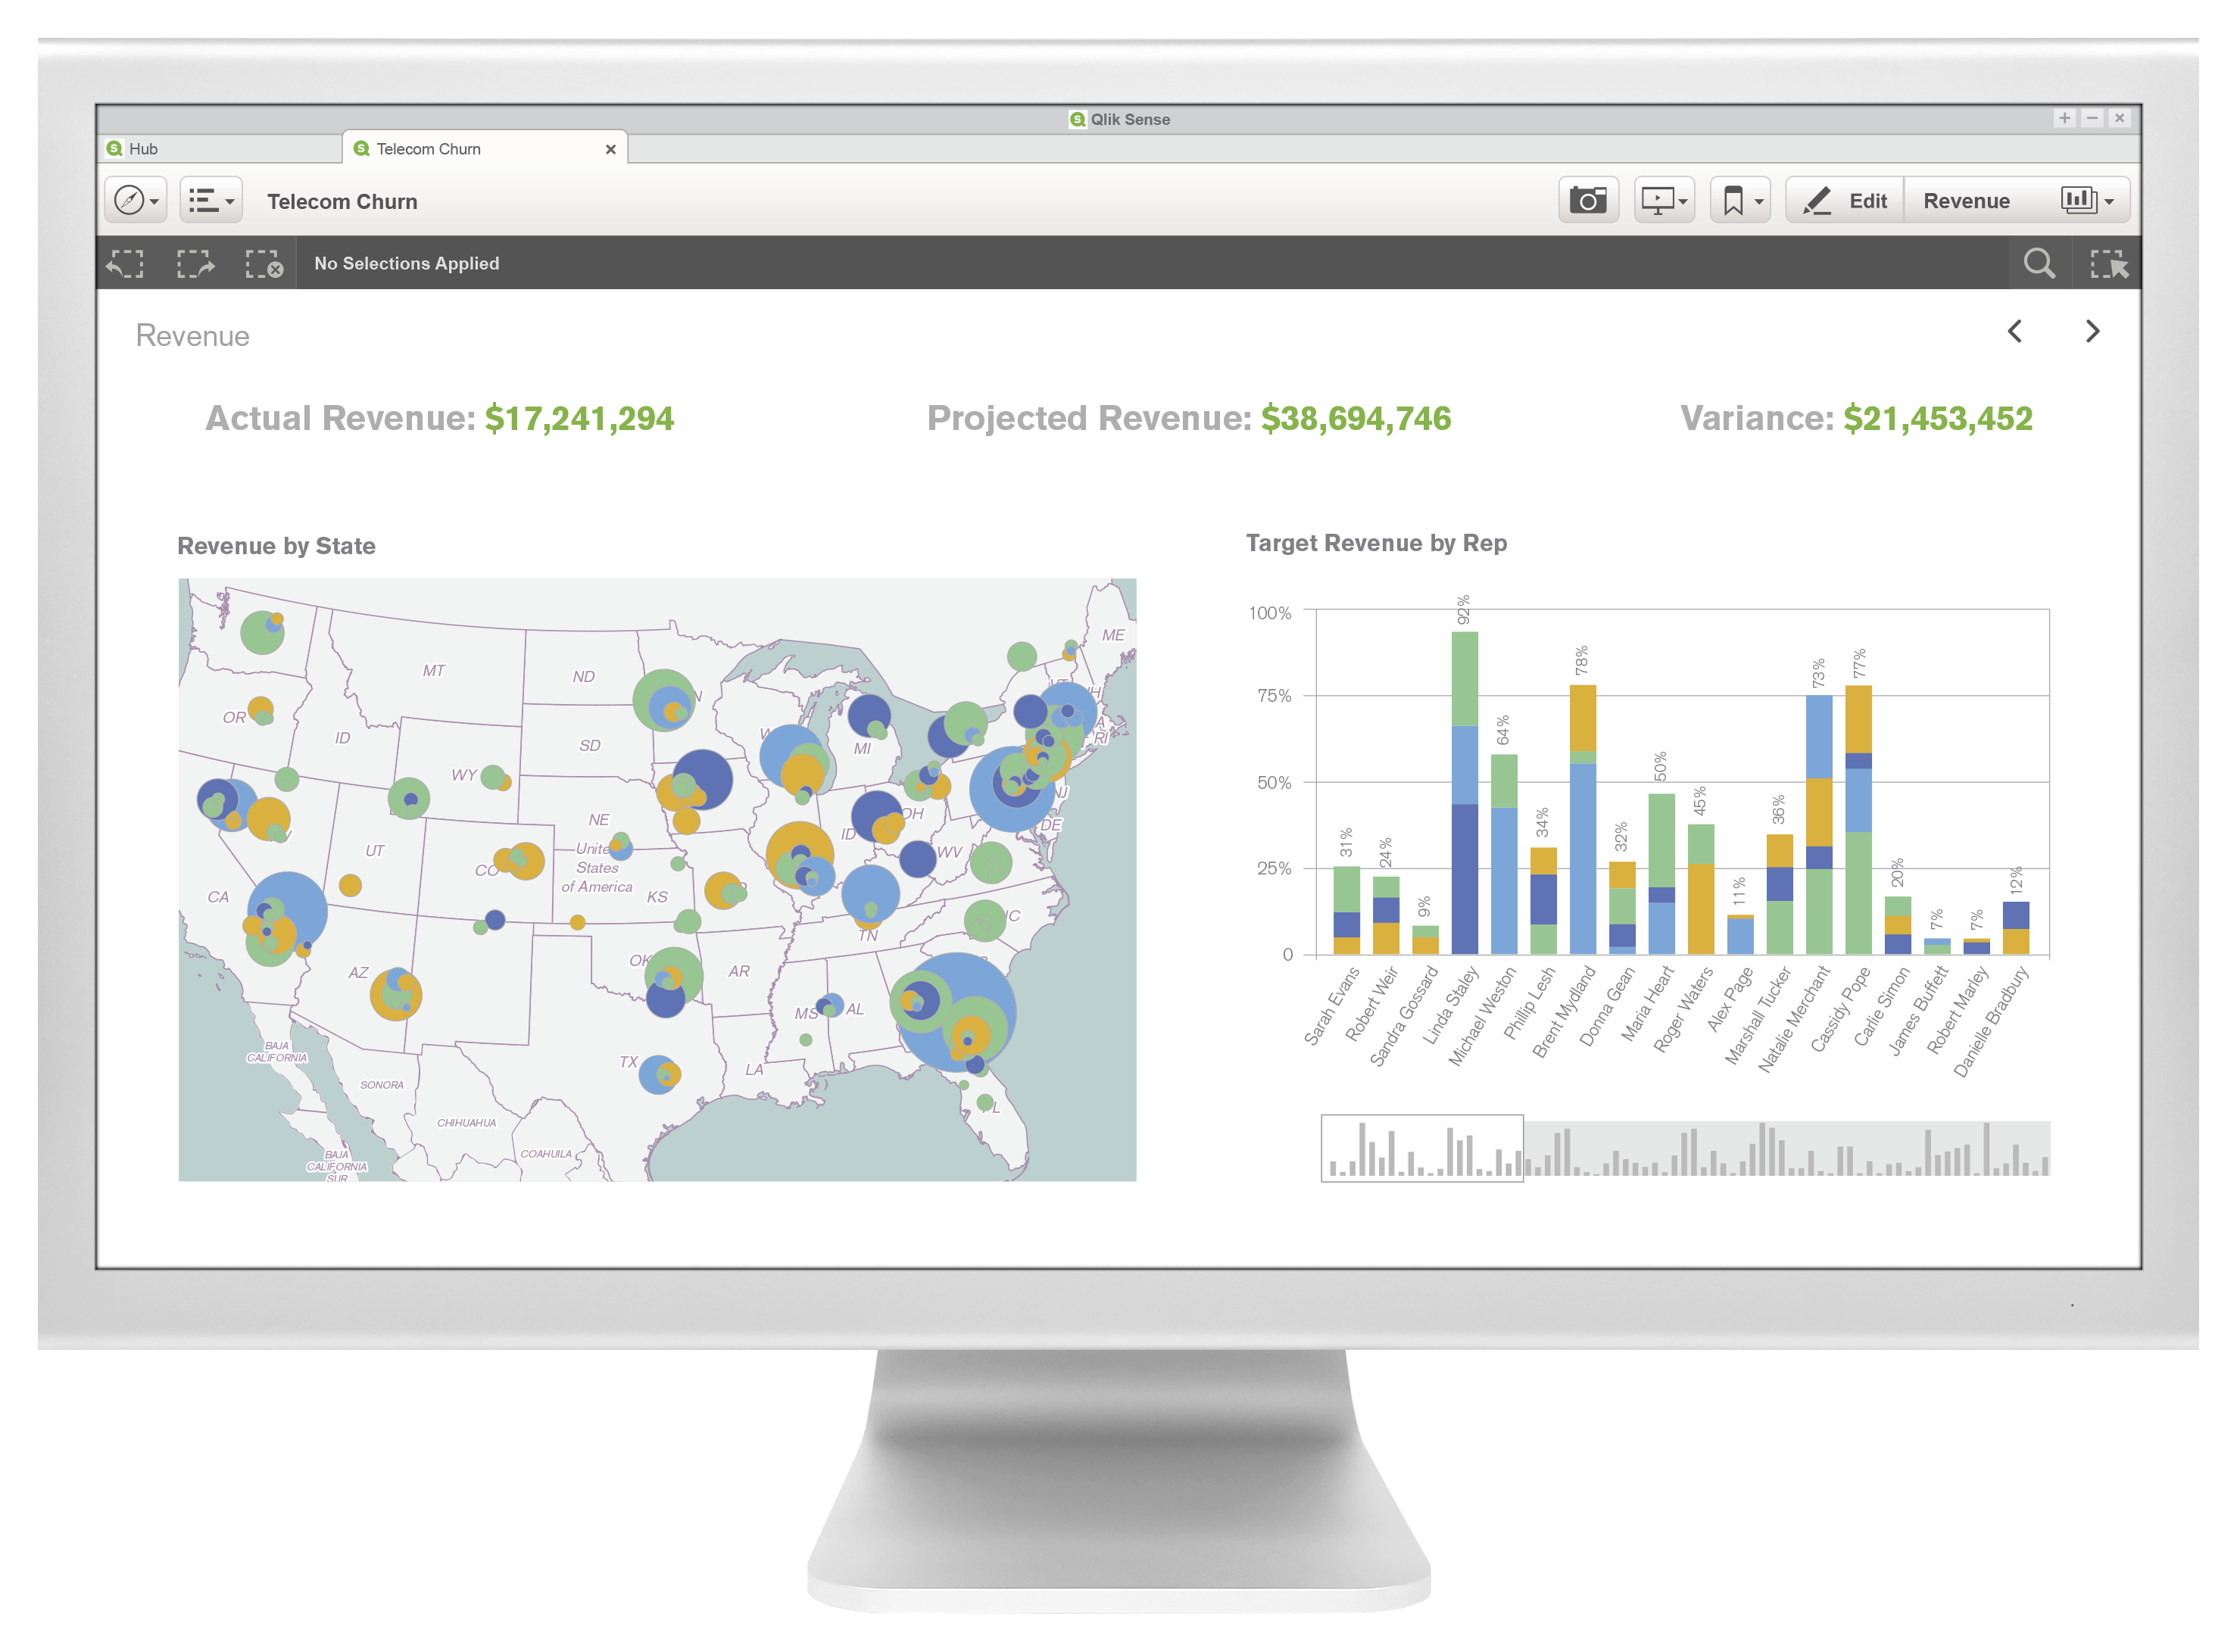
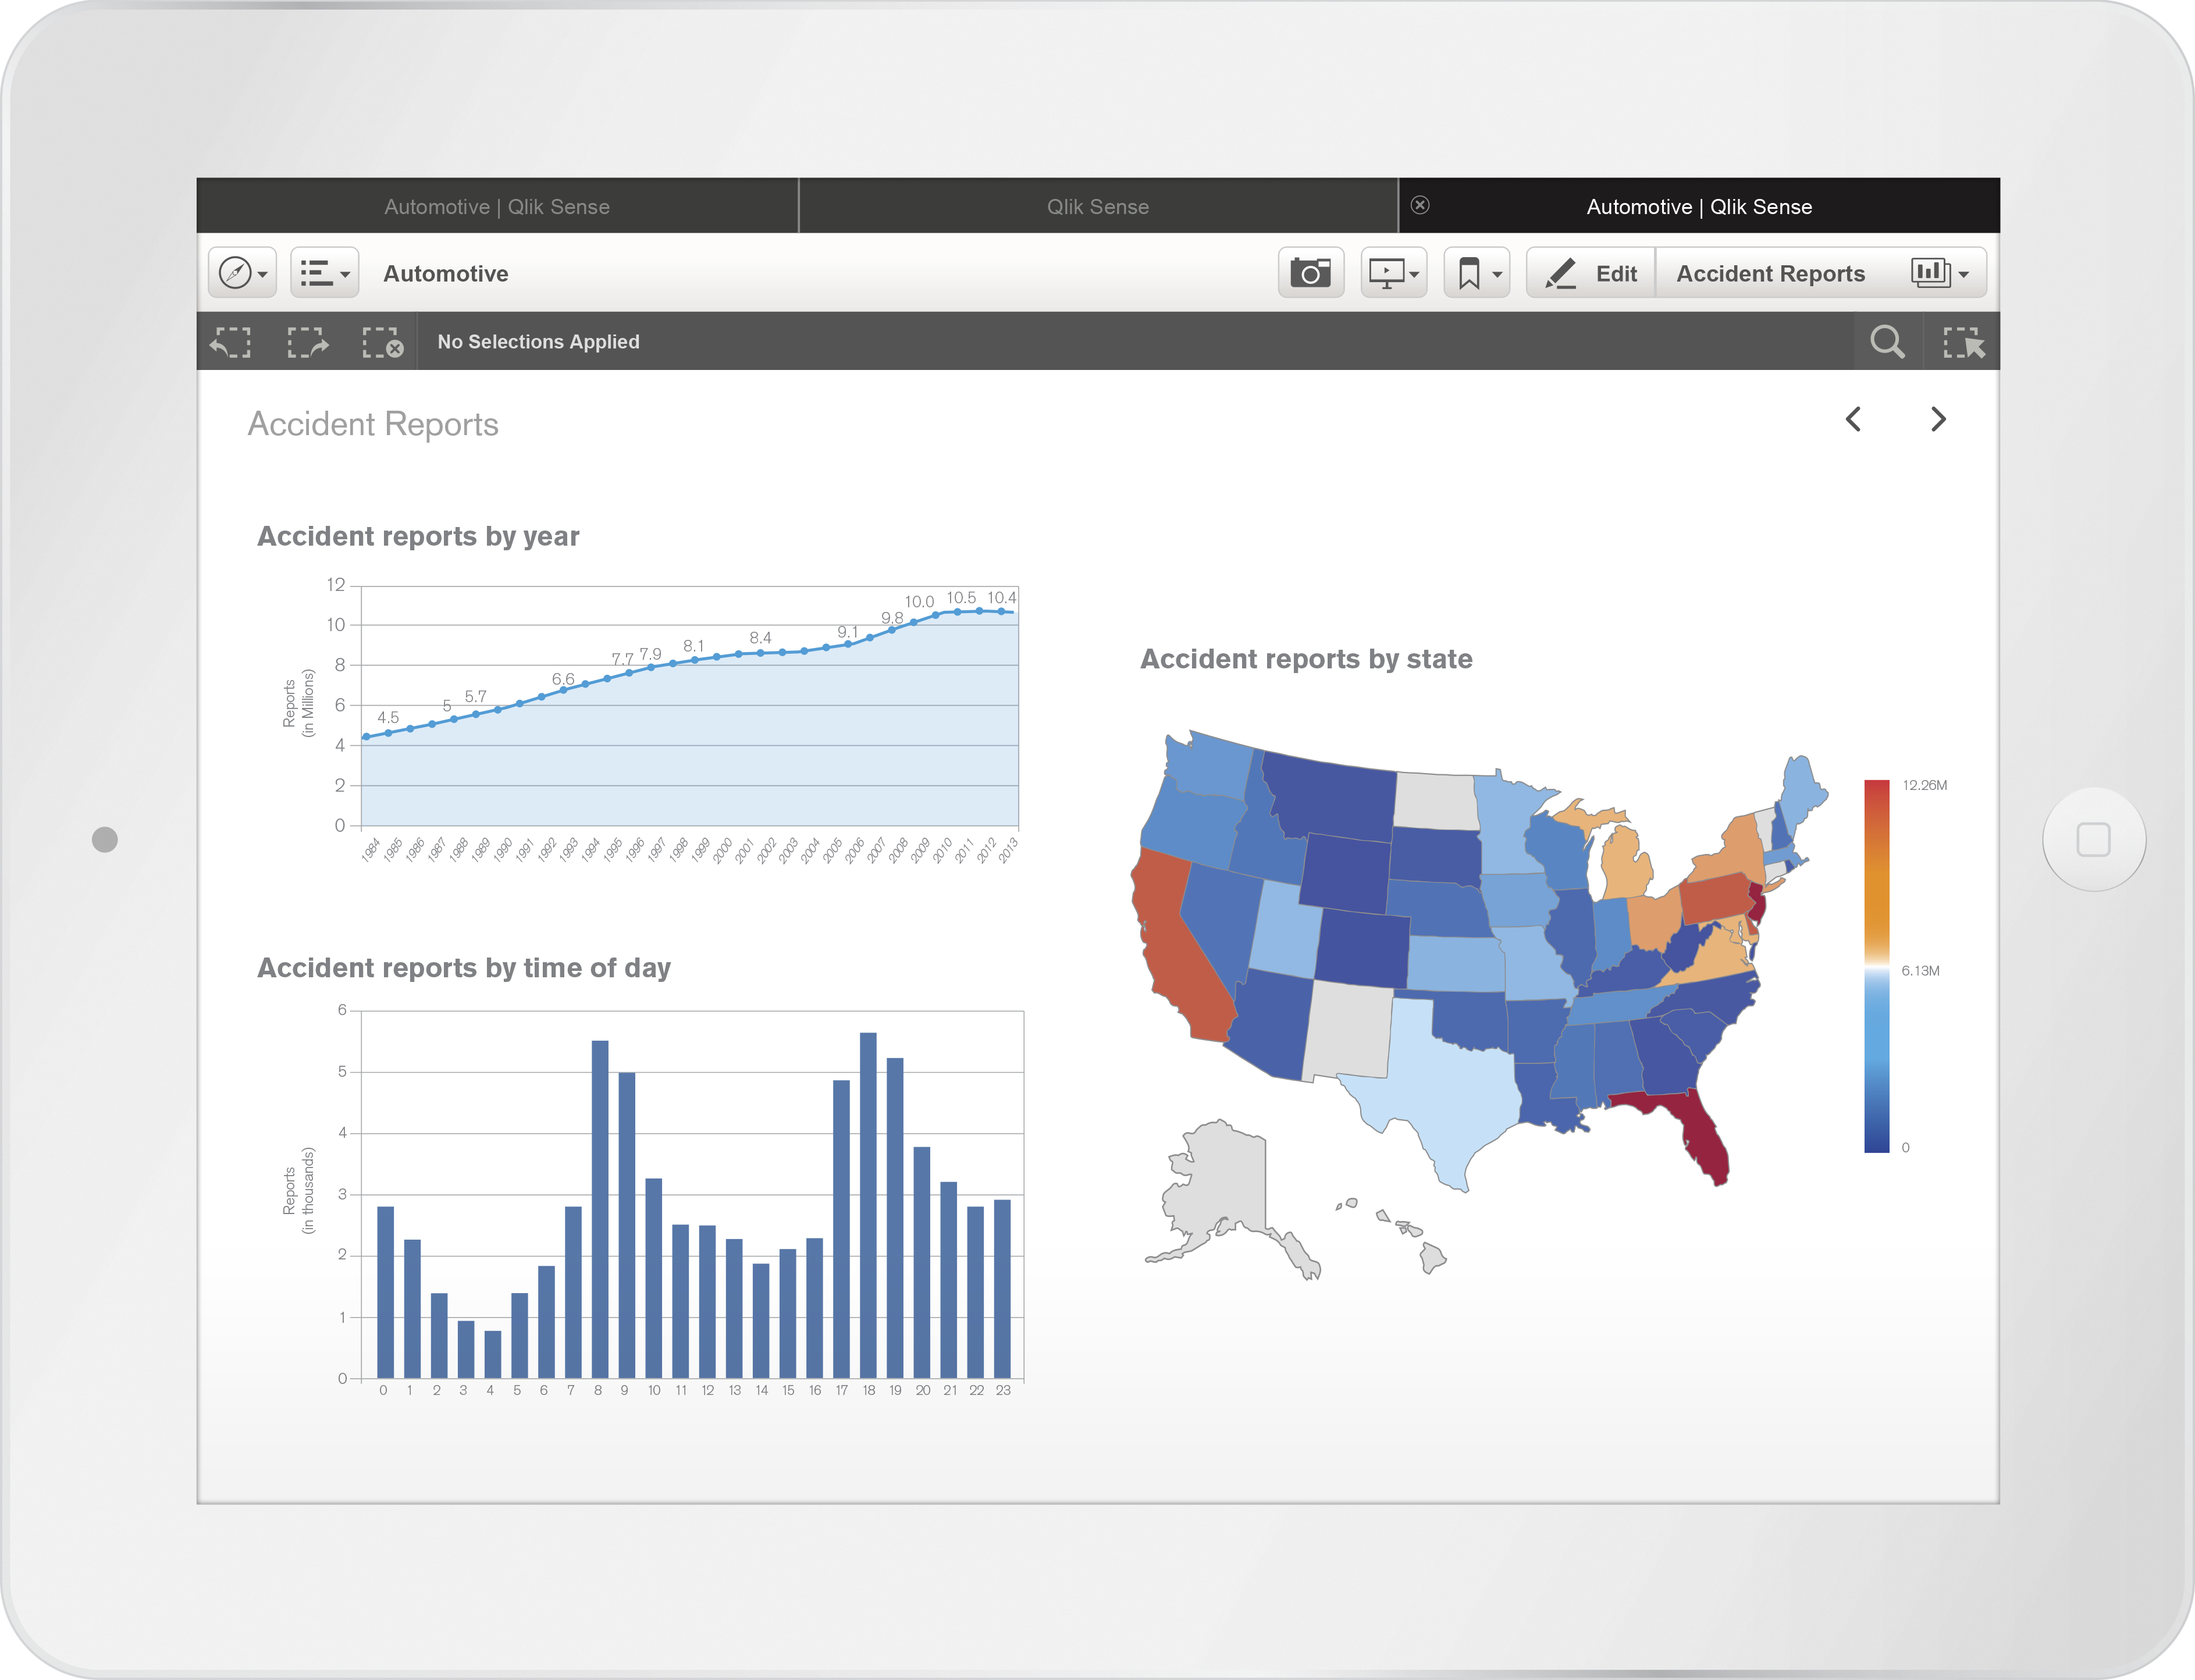
Qlik strives to make data literacy more accessible to everyone in an organization. The software does this by leveraging many different options for visualizing data, which users can build using drag-and-drop features.
These visualizations allow a surprising amount of granularity, considering how well they summarize large groups of data. Users are able to request data views as specific as “quarterly sales in a given region” in plain conversational, requests.
Qlik also uses an associative engine to help reveal insights that can be easily lost to human error. This focus on showing associative data tends to surface insights a human would not have on their own. While this is good for viewing the same data sources in different ways, some users might find the experience overwhelming.
Tableau
Pros
Cons
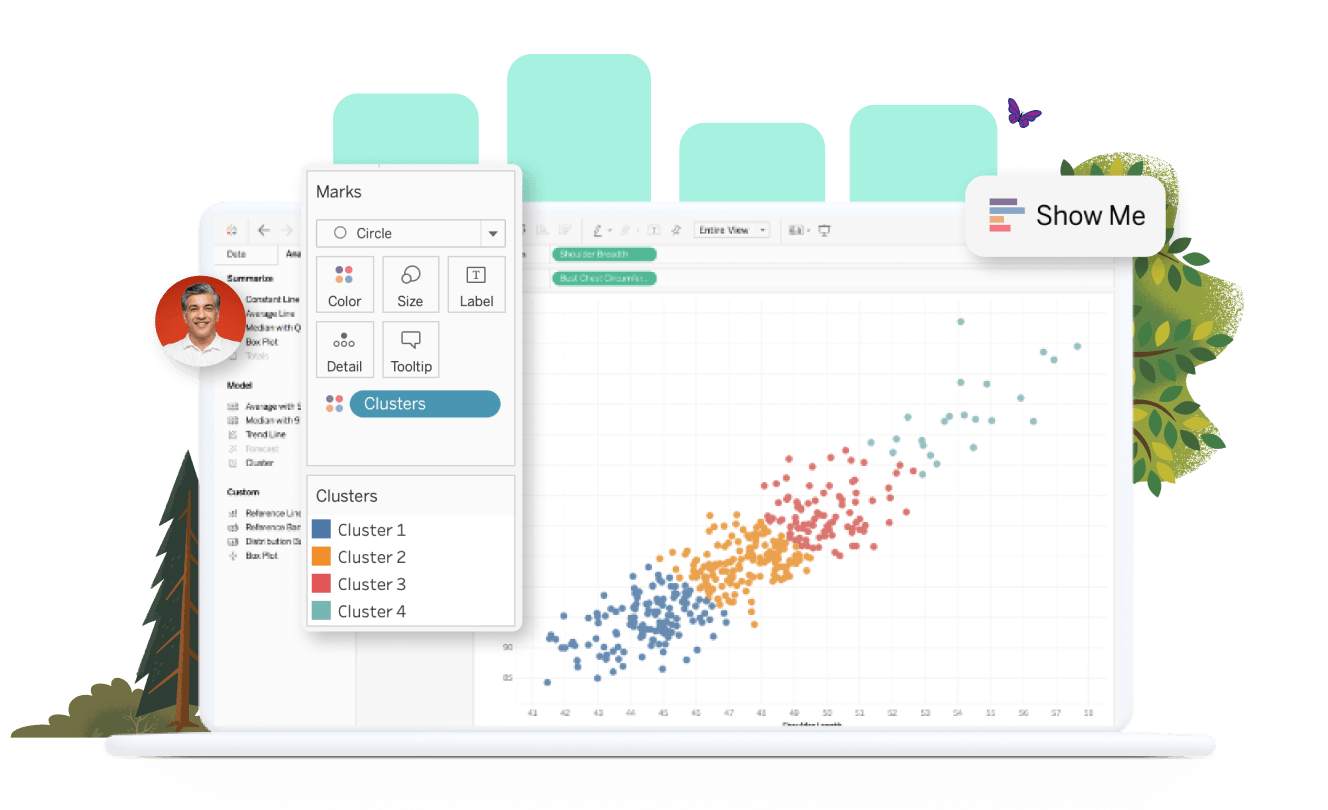
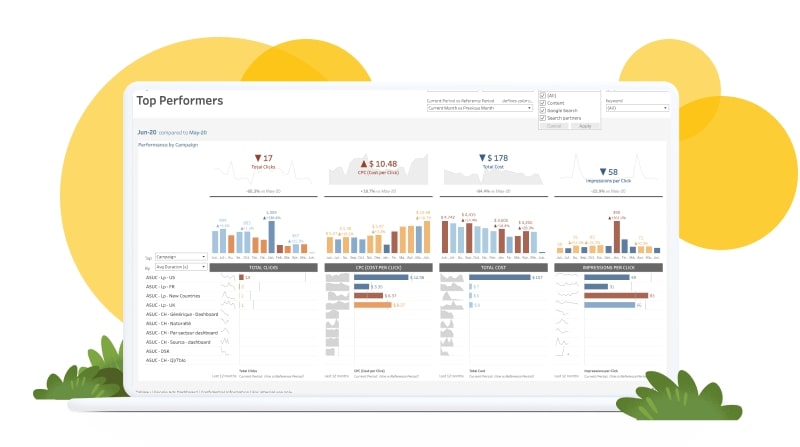


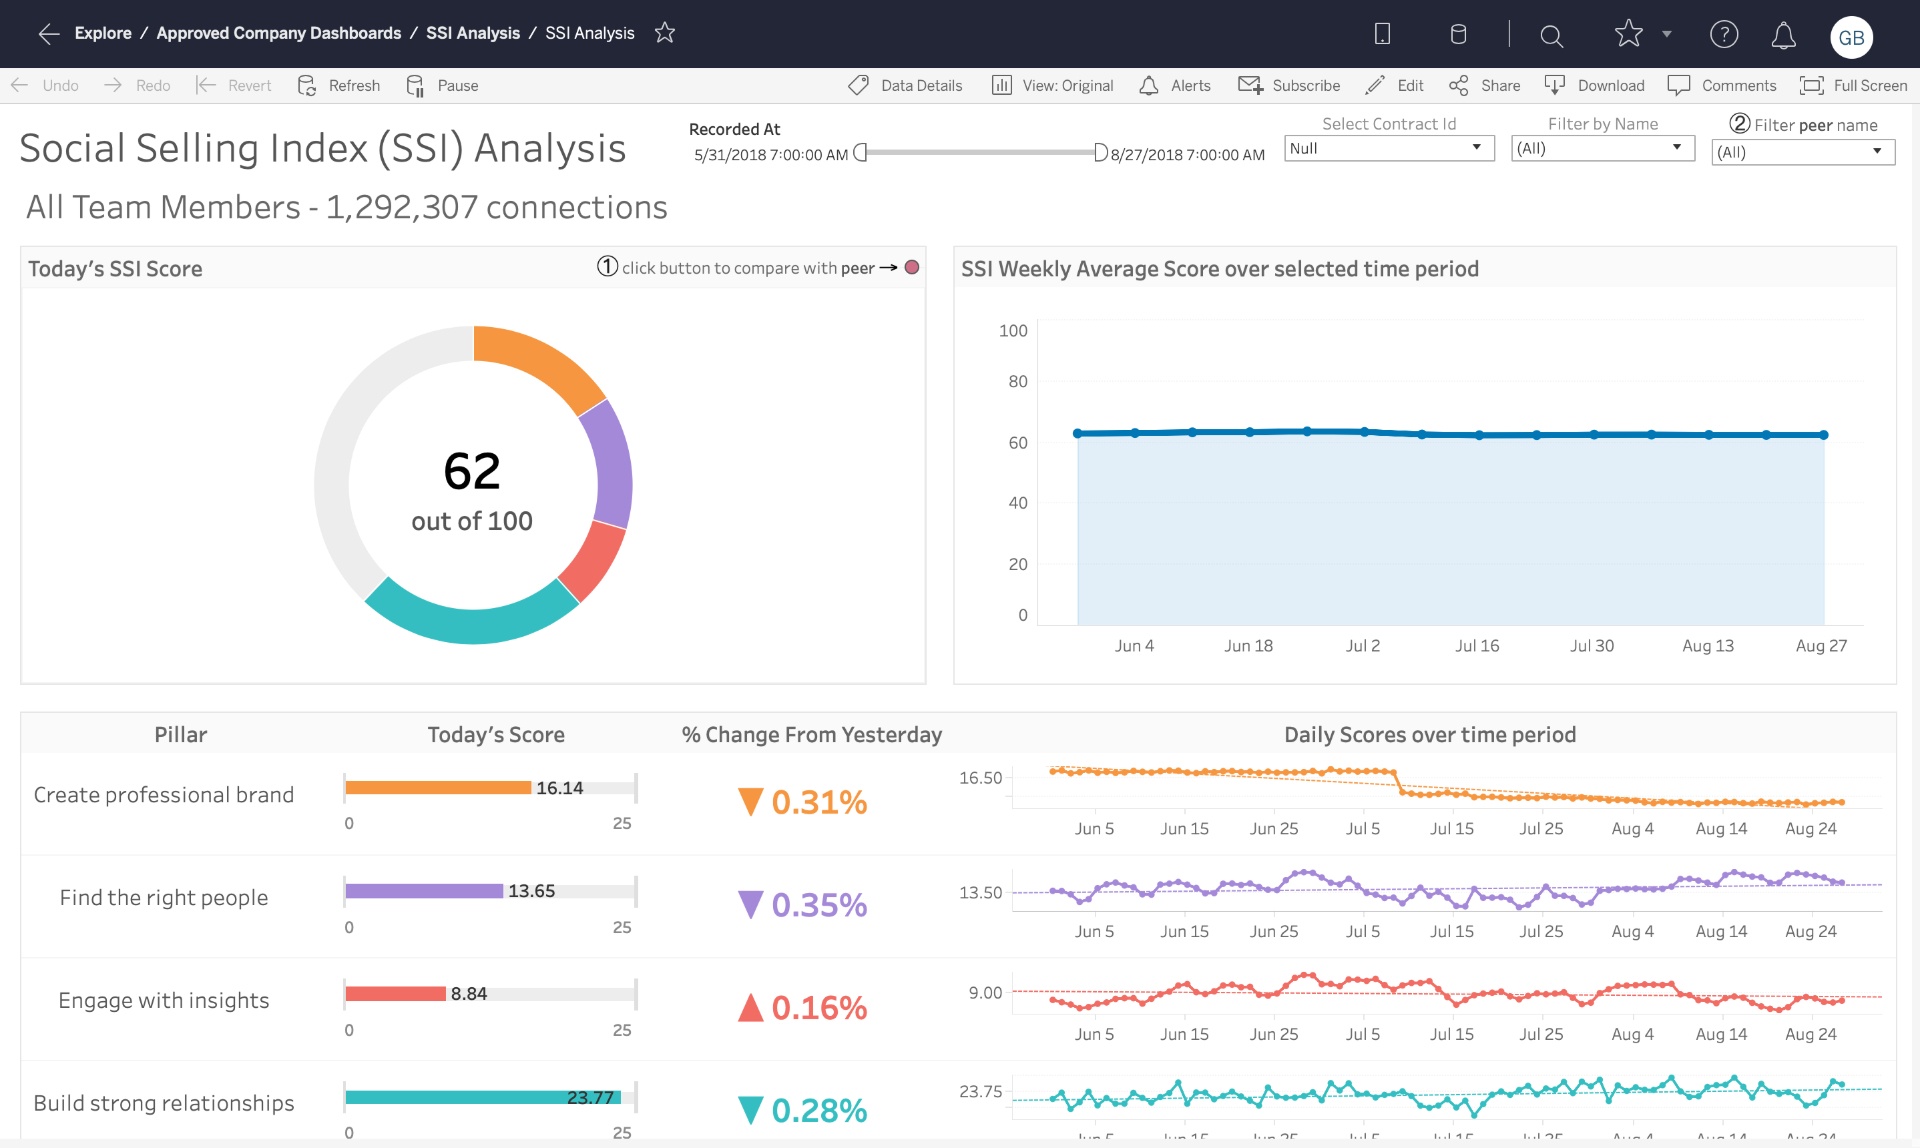
Tableau helps users tell stories with data by making it easier to find and share insights. Customizable, user-friendly dashboard tools let analysts generate graphs and reports for forecasting, spotting trends, and more.
Tableau’s query-based approach gives users a more hands-on experience and allows for exacting deployment of only the data points a user has personally sought out. Although this empowers individual users to find answers for themselves, it may do so at the cost of unexpected insights.
Tableau also lets users present data analysis as a story, using slideshow tools like Microsoft PowerPoint to help analysts create narratives. This simplifies the process of parsing data and translating it for broader business audiences.
Qlik vs. Tableau: Pricing
Qliksense
Business plan: Priced at $30 per user per month, it includes full access to Qlik’s Associative Big Data Index, augmented intelligence, and shared and managed spaces.
Enterprise plan: Pricing varies based on the organization’s size and specific needs. It offers additional capabilities like unlimited sharing, collaborative development spaces, and governed libraries.
QlikView
Personal edition: Free of cost, but limited to personal use without the ability to share documents.
Enterprise plan: Pricing is quote-based, with licenses typically sold as a package including a number of CALs (Client Access Licenses).
Tableau
Tableau Viewer: At $12 per user per month, this plan offers a way to share insights across the organization. It also requires at least one Tableau Creator subscription.
Tableau Explorer: Priced at $35 per user per month, it requires at least one Tableau Creator subscription. It provides self-service analytics on a governed data platform.
Tableau Creator: At $70 per user per month, it includes Tableau Desktop, Tableau Prep Builder, and one Creator license of Tableau Server or Tableau Online.
Qlik vs. Tableau: A Detailed Comparison
Deployment
Depending on your organization’s needs, Qlik and Tableau offer different deployment options. For Qlik, businesses can choose from a selection of software as a service (SaaS), on-premises, or private cloud for deployment. Similarly, Tableau comes as an on-premises or cloud-based solution.
Qlik prioritizes scalability with its multi-node deployment options, allowing massive enterprises to locally house and access their own instance of Qlik. For smaller operations, though, this may be excessive.
Tableau deployment is usually faster and simpler compared to Qlik. However, large businesses may experience bottlenecks when bloated servers are forced to manage more requests than they are equipped to handle.
HR Analytics
Both Qlik and Tableau handle the less obvious number-crunching that human resource (HR) analytics requires.
Qlik aids talent acquisition initiatives by monitoring data at large businesses that would otherwise be a time-consuming process for an individual. The data Qlik provides can be anything from departmental headcounts to the precise spending areas for hiring budgets. By utilizing its AI to display data like employee development and training costs, Qlik becomes a useful and responsive HR companion.
Tableau carefully monitors turnover rates, retention headcounts, and intracompany movements. Crucial data points like slowly increasing turnover rates or steady intracompany movement are revealed with very little coaxing from Tableau’s HR tracking capabilities. This data is also easily collated by Tableau for stakeholder presentations, keeping everyone in the loop no matter their proximity to the hiring process or stake in HR budgets.
Security
Both Qlik and Tableau support multiple users with role-based permissions, so companies don’t have to worry about the wrong people viewing data they shouldn’t be able to access.
Additionally, system administrators can also enable multi-factor authentication (MFA) as an extra safeguard against weaker passwords. For Qlik, an enterprise can set up MFA using Okta, and Tableau users can use Duo.
For maximum security, both solutions offer single sign-on (SSO) capabilities. This is ideal for organizations looking to minimize the threat compromised user passwords pose for companies’ most valuable data.
Data modeling
Qlik
Qlik uses an associative data model, which means that all data loaded into Qlik is interconnected. This model allows users to make selections in one field and instantly see related data in other fields, even if they aren’t directly connected. Qlik’s in-memory technology ensures that data is available for immediate exploration without the need for pre-aggregated data or cubes. This results in faster response times and real-time data analysis. The platform also provides a scripting environment for data transformation and manipulation. While this offers flexibility, it does require developer skills.
Tableau
Tableau emphasizes a visual data modeling, making it user-friendly for those without a technical background. This visual approach to data modeling allows users to see the structure of their data as they work. Tableau offers data blending capabilities, which means it can pull data from various sources and blend it on a common dimension. This is useful when working with data that isn’t stored in a single repository.
Unlike Qlik, Tableau doesn’t rely heavily on scripting for data modeling. This can be advantageous for users who prefer a more intuitive, visual approach to data analysis. The application uses a concept called “extracts,” which are snapshots of data optimized for aggregation. This can improve performance but may require regular updates to ensure data freshness.
Qlik vs. Tableau: How to Choose the Right BI Solution
Qlik and Tableau are powerful BI software solutions that offer numerous advantages, but one may meet your organization’s unique needs better than the other.
Qlik comes equipped with robust, AI-backed data parsing capabilities. The automatic report visualization and intelligent query features make it an invaluable tool for large enterprises working with large volumes of raw information.
Tableau, on the other hand, is an excellent fit for single-office enterprises and small businesses. From its deployment to its data management, Tableau is agile and powerful enough to handle complex workloads without being overwhelming for small teams.
Qlik and Tableau are some of the most popular business intelligence systems on the market, but that doesn’t necessarily mean your search should end here. If you want to save hours on the search for the right business intelligence solution, explore our complete list of business intelligence software. Our advisors can help you narrow down the top options for your business’s unique needs.
Featured partners
Featured partners
FAQs
How does Qlik compare to Tableau as a business intelligence solution?
Qlik and Tableau are both highly-regarded business intelligence solutions, with Qlik excelling in data integration and manipulation, and offering a unique associative model, while Tableau is often praised for its intuitive, visually-focused data exploration and interactive dashboard capabilities.
What factors should I consider when choosing between Qlik and Tableau?
When choosing between Qlik and Tableau, consider factors such as your team’s skill level, the complexity of your data integration needs, your preference for data visualization and exploration, budget constraints, and the specific requirements of your business intelligence use case.